Frequency
Distributions
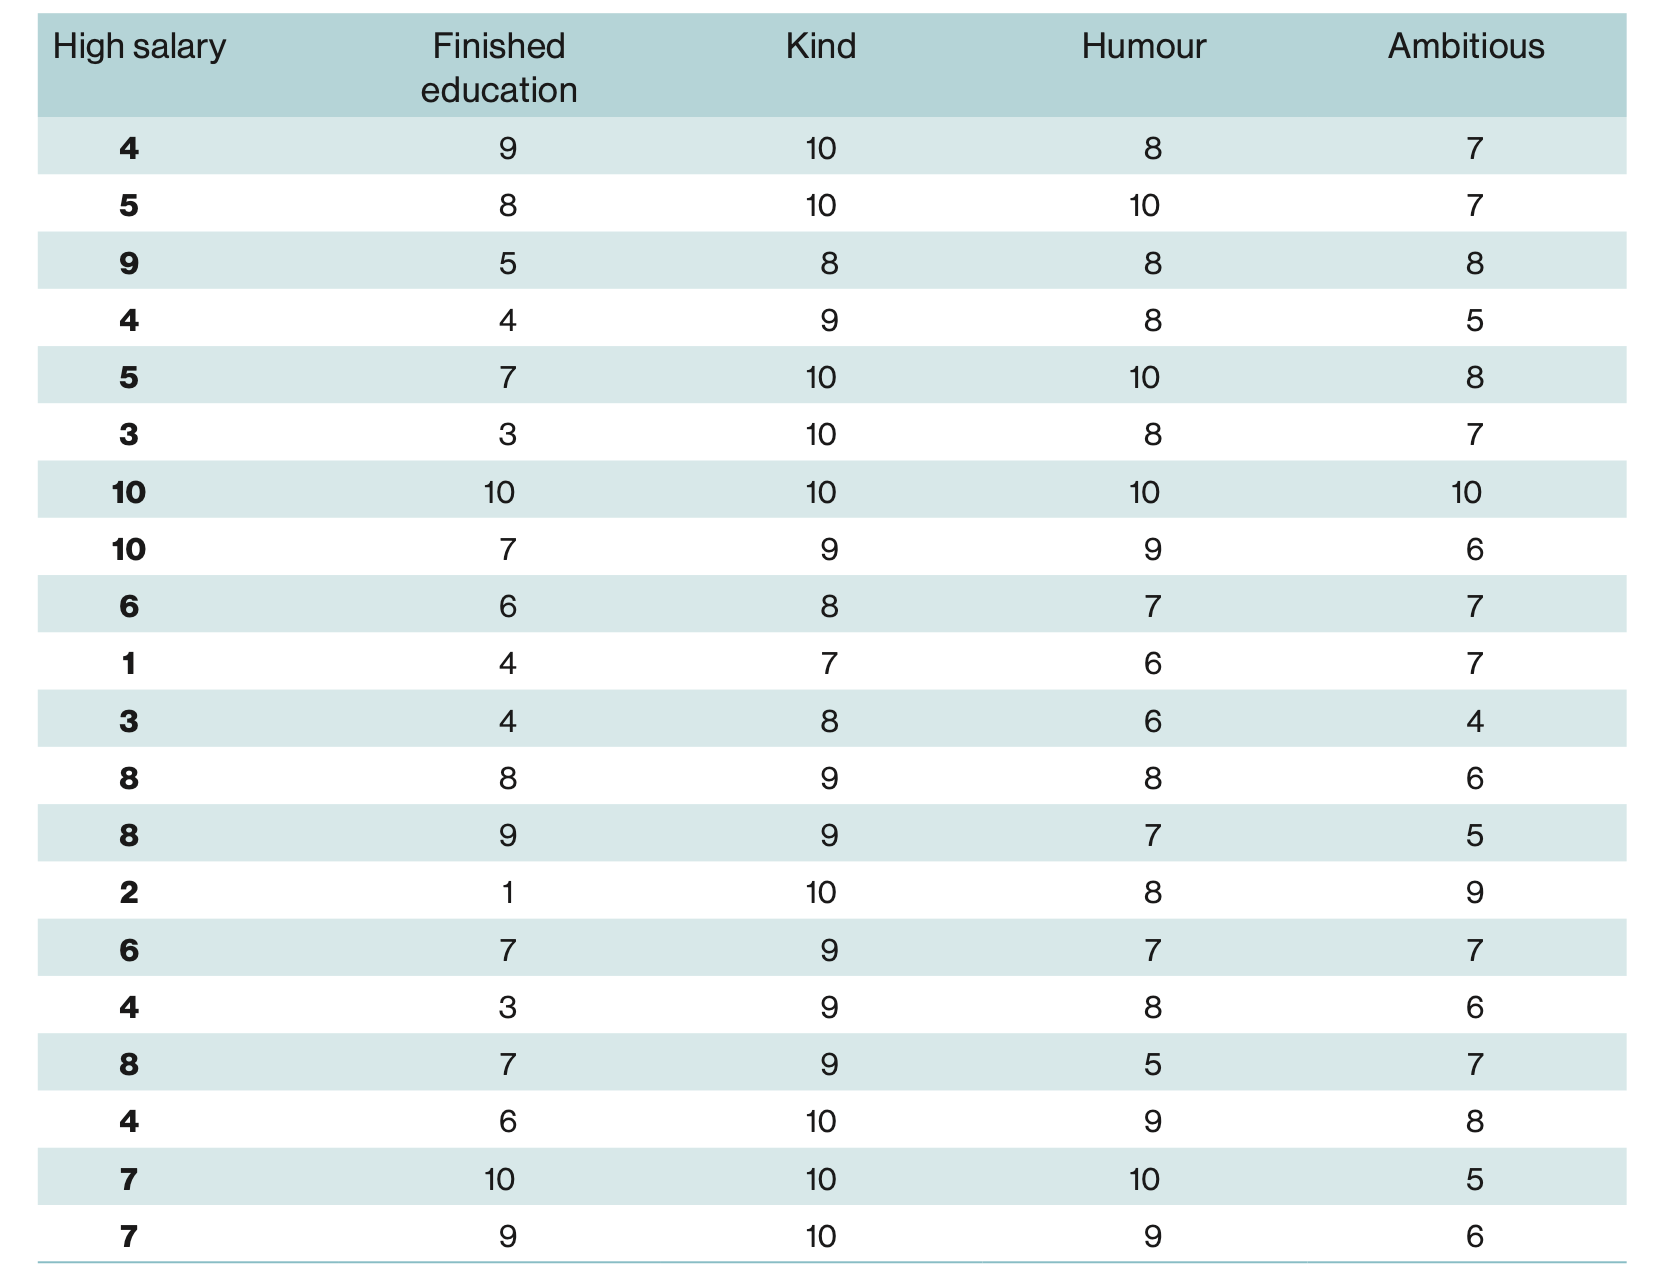
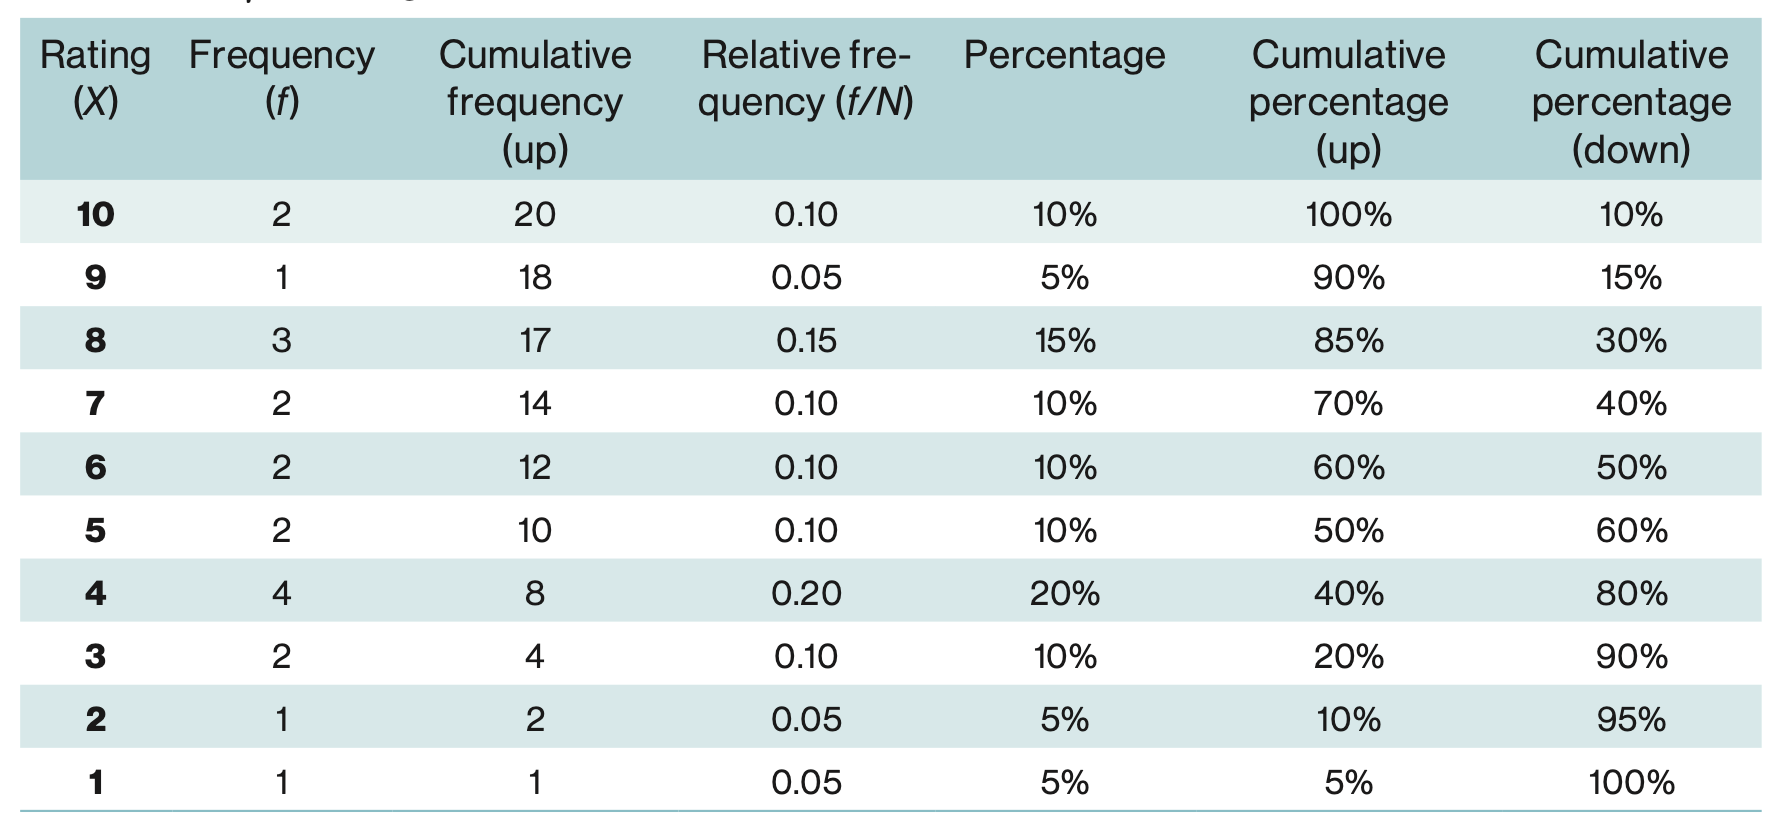
Frequency Distribution
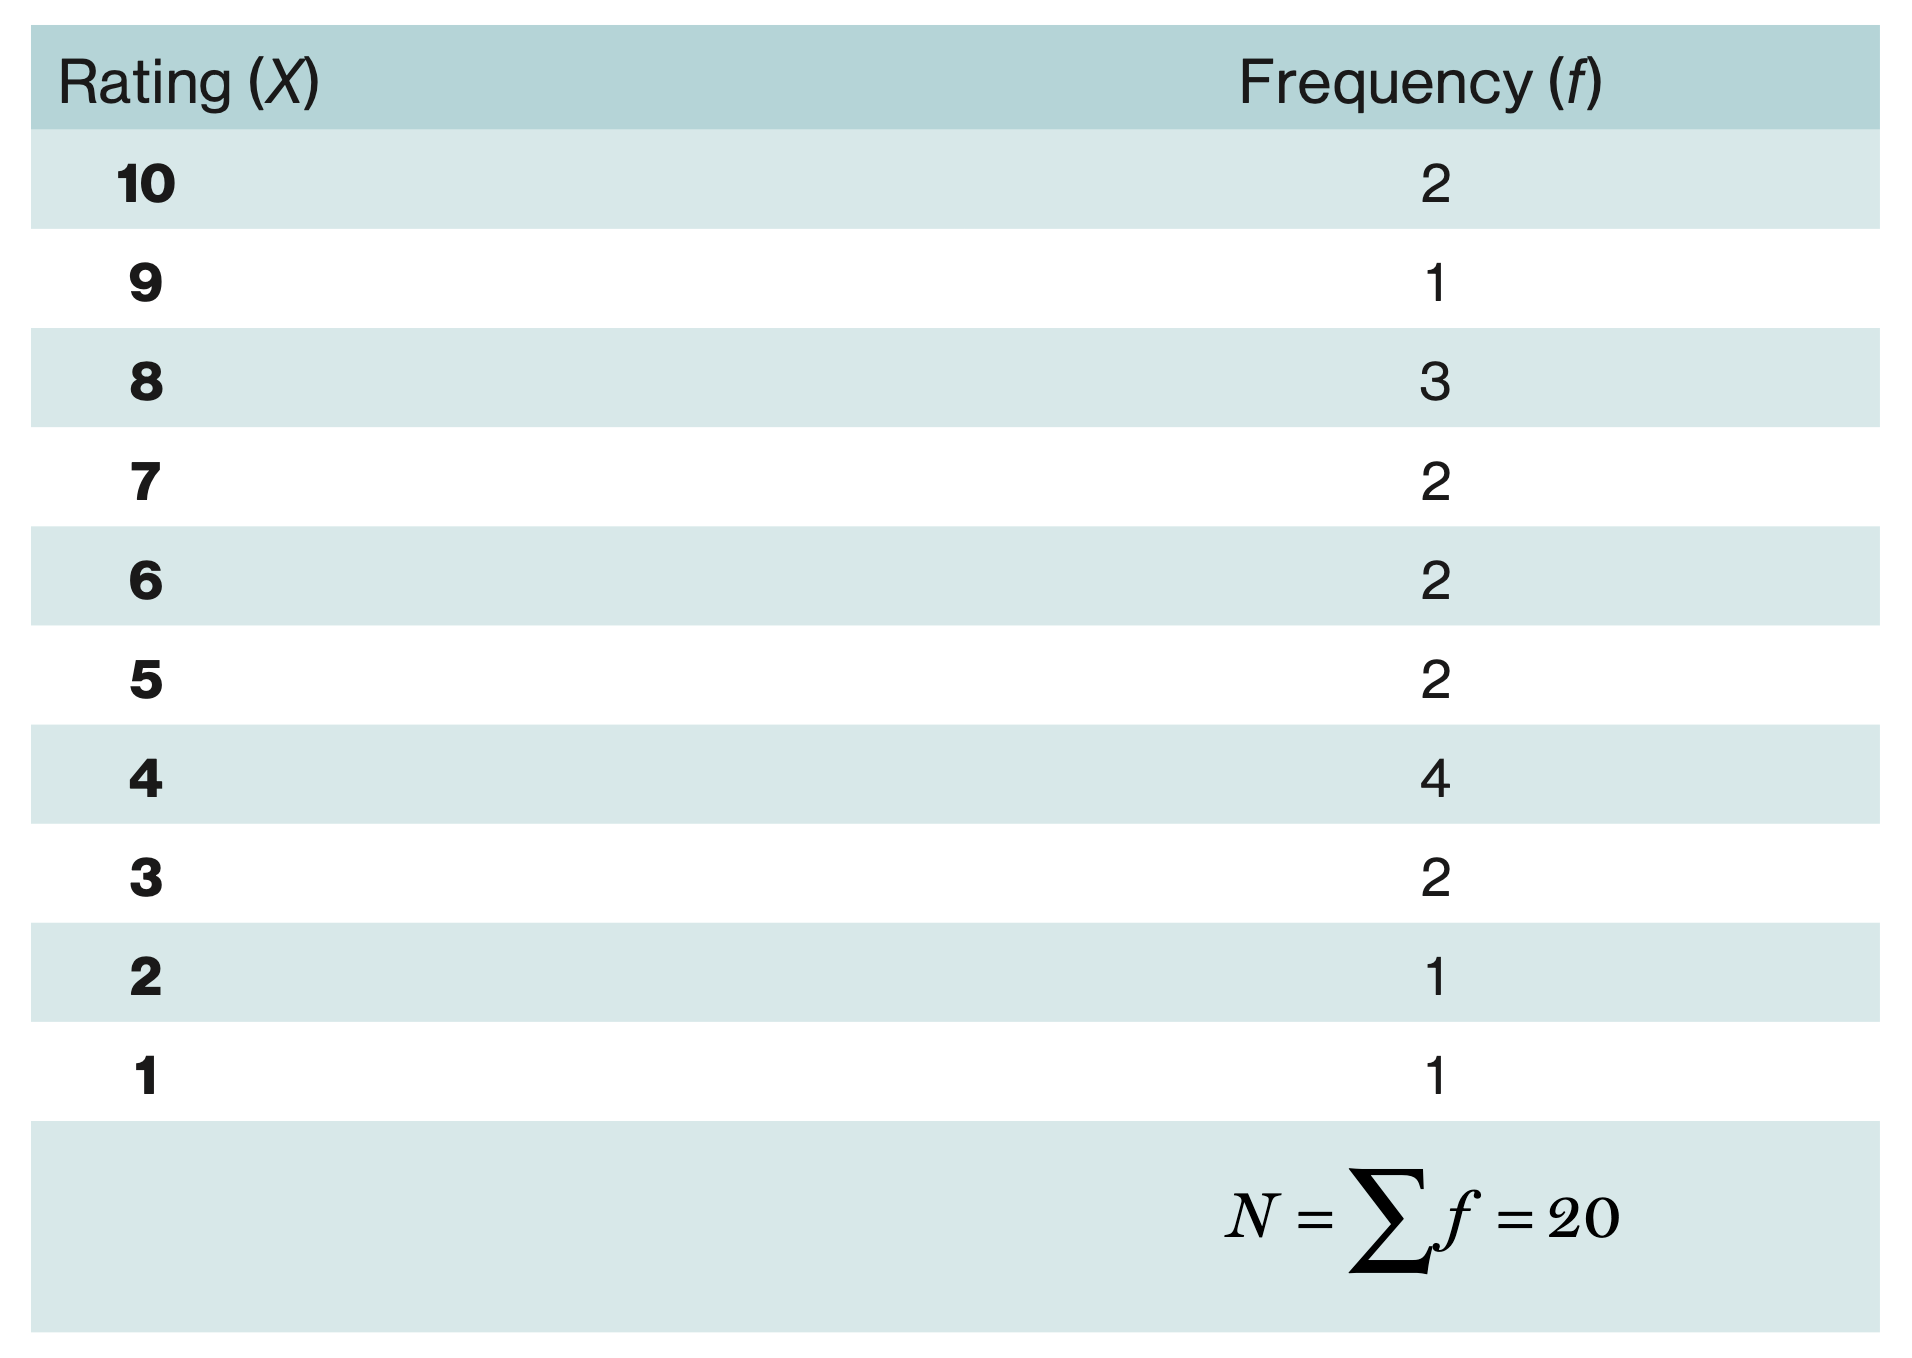
Frequency: how many times each score occurs.
If you add up the frequencies (\(\sum f\)) you get the sample size (\(N\)).
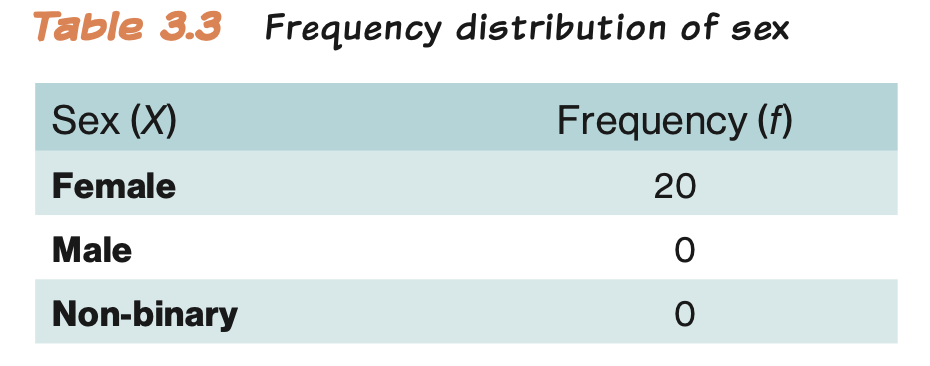
We should mention the category even if the freqency is zero.
🤯 Your Turn
Calculate Relative Frequency for score 4 on High Salary.
Your Turn: Answer
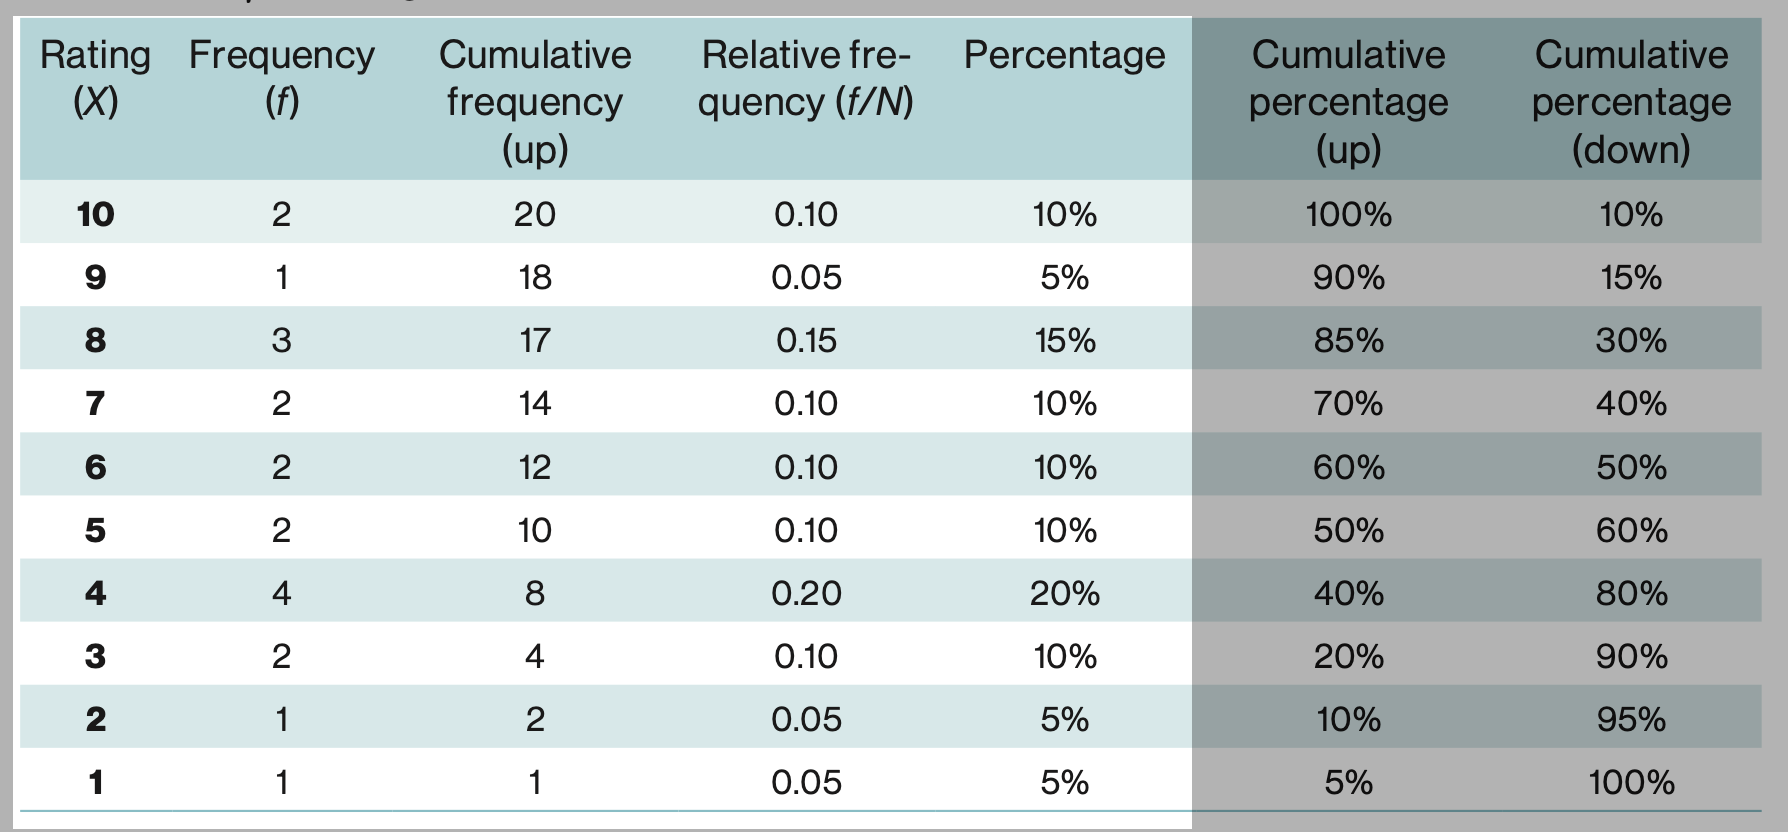
Cumulative Percentage
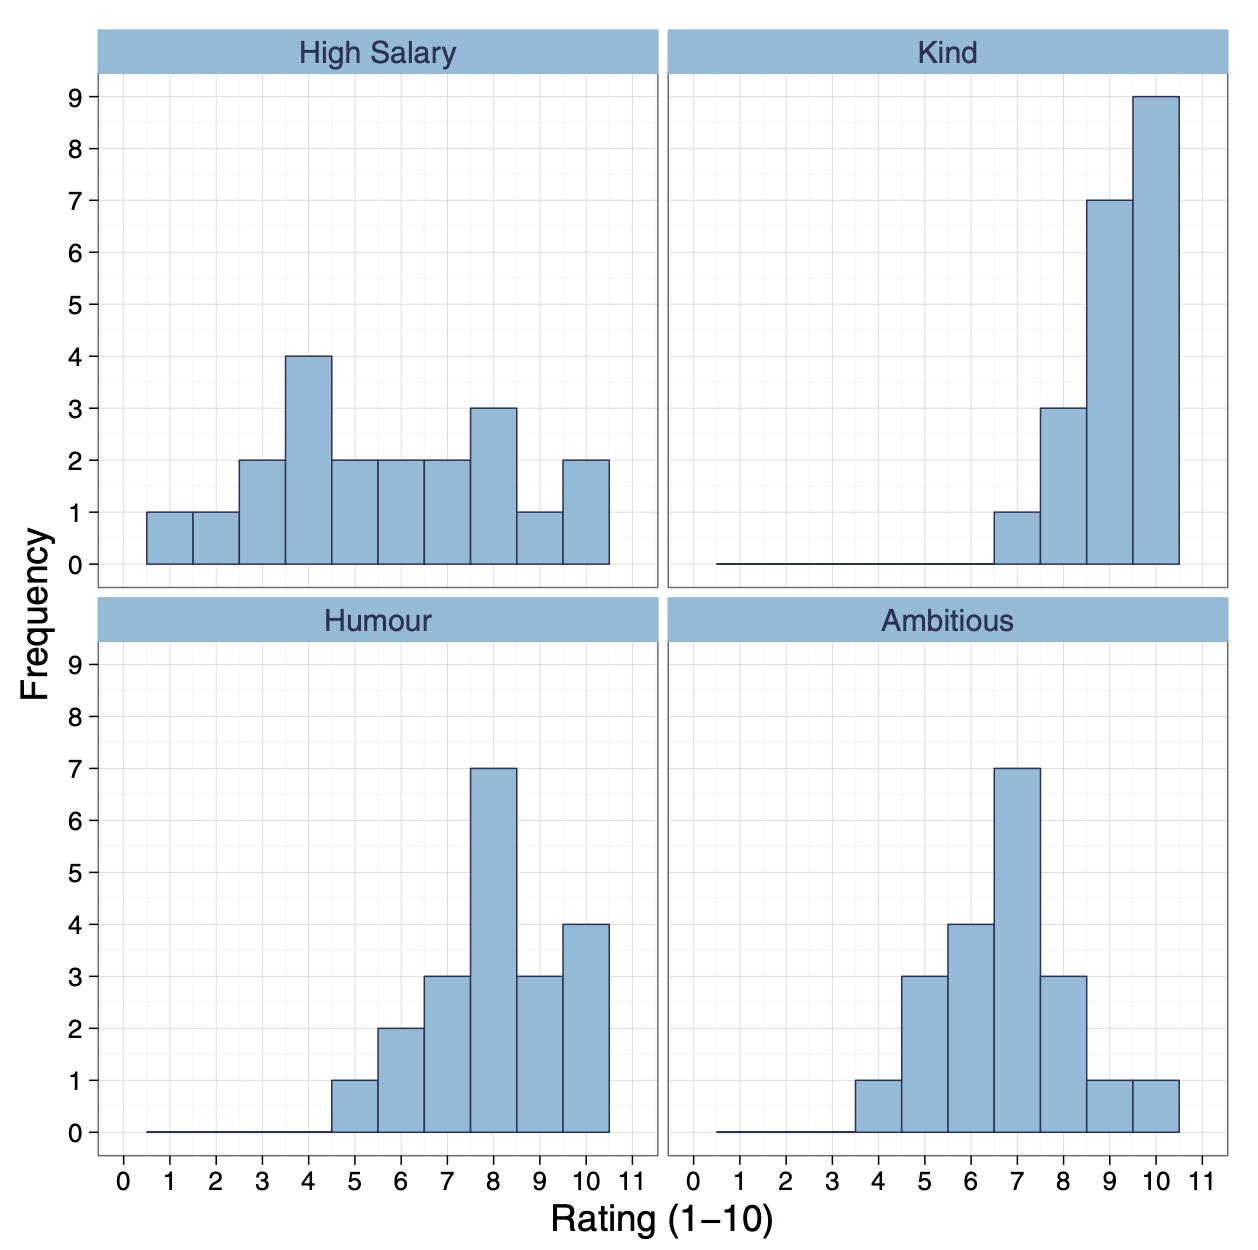
Graphical Frequency Distributions: Histograms
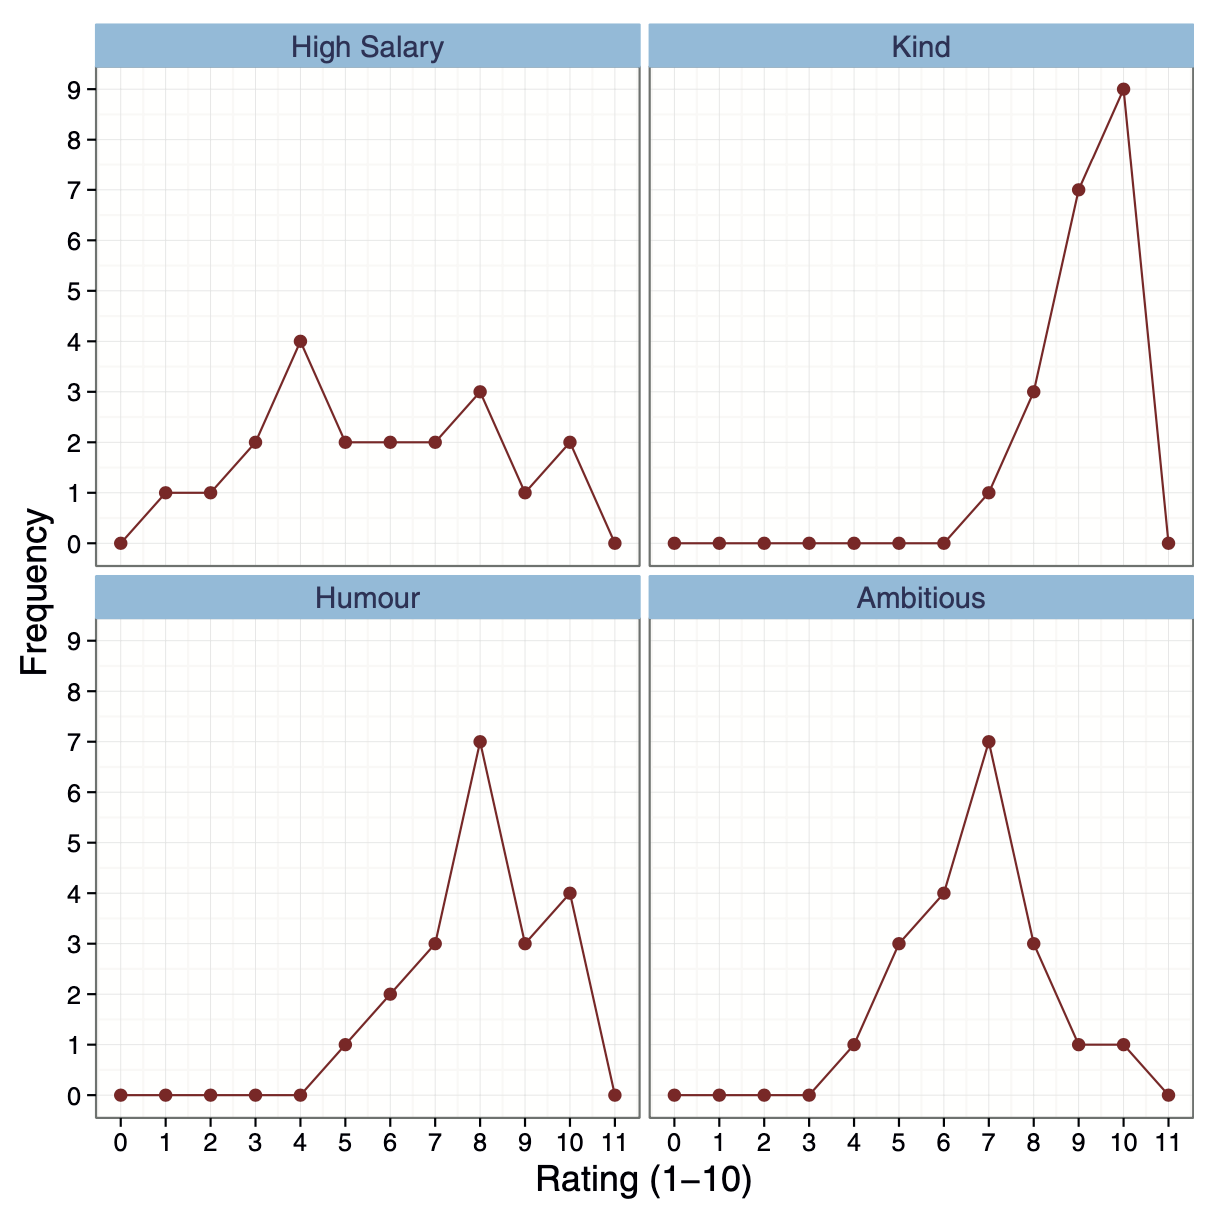
Graphical Frequency Distributions: Frequency Polygon
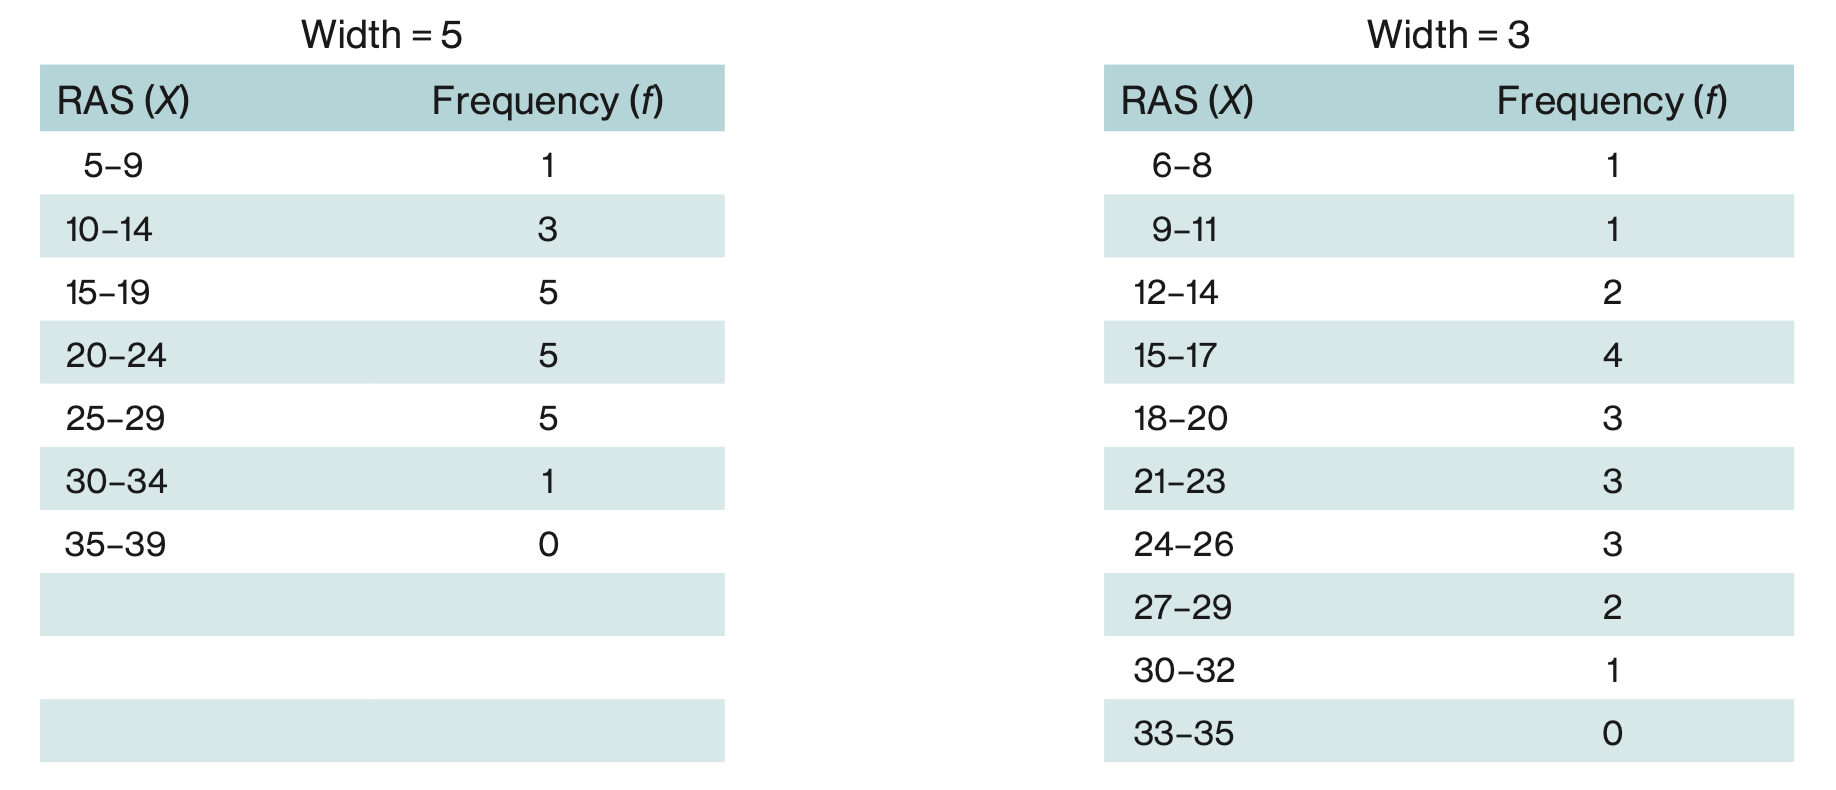
Grouped Frequency
“a frequency distribution where we group scores together”
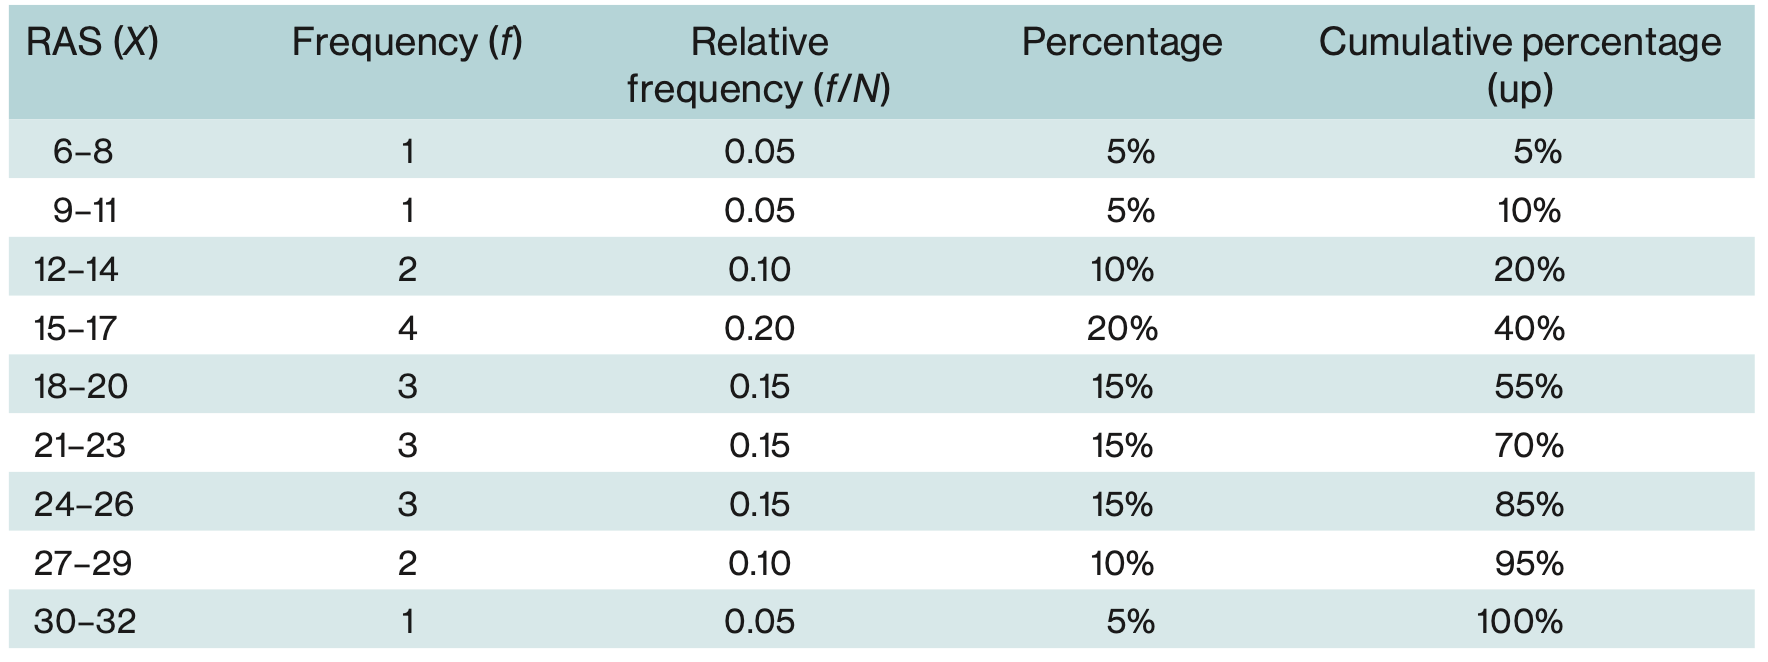
95% of them rated their relationship satisfaction lower than Alisha (32).