Learning
Probability

Probability Density Function
The area under the curve represents probability which is equal to \(1\) or the probability of all scores summed together is \(1\).

Standard Normal Distribution
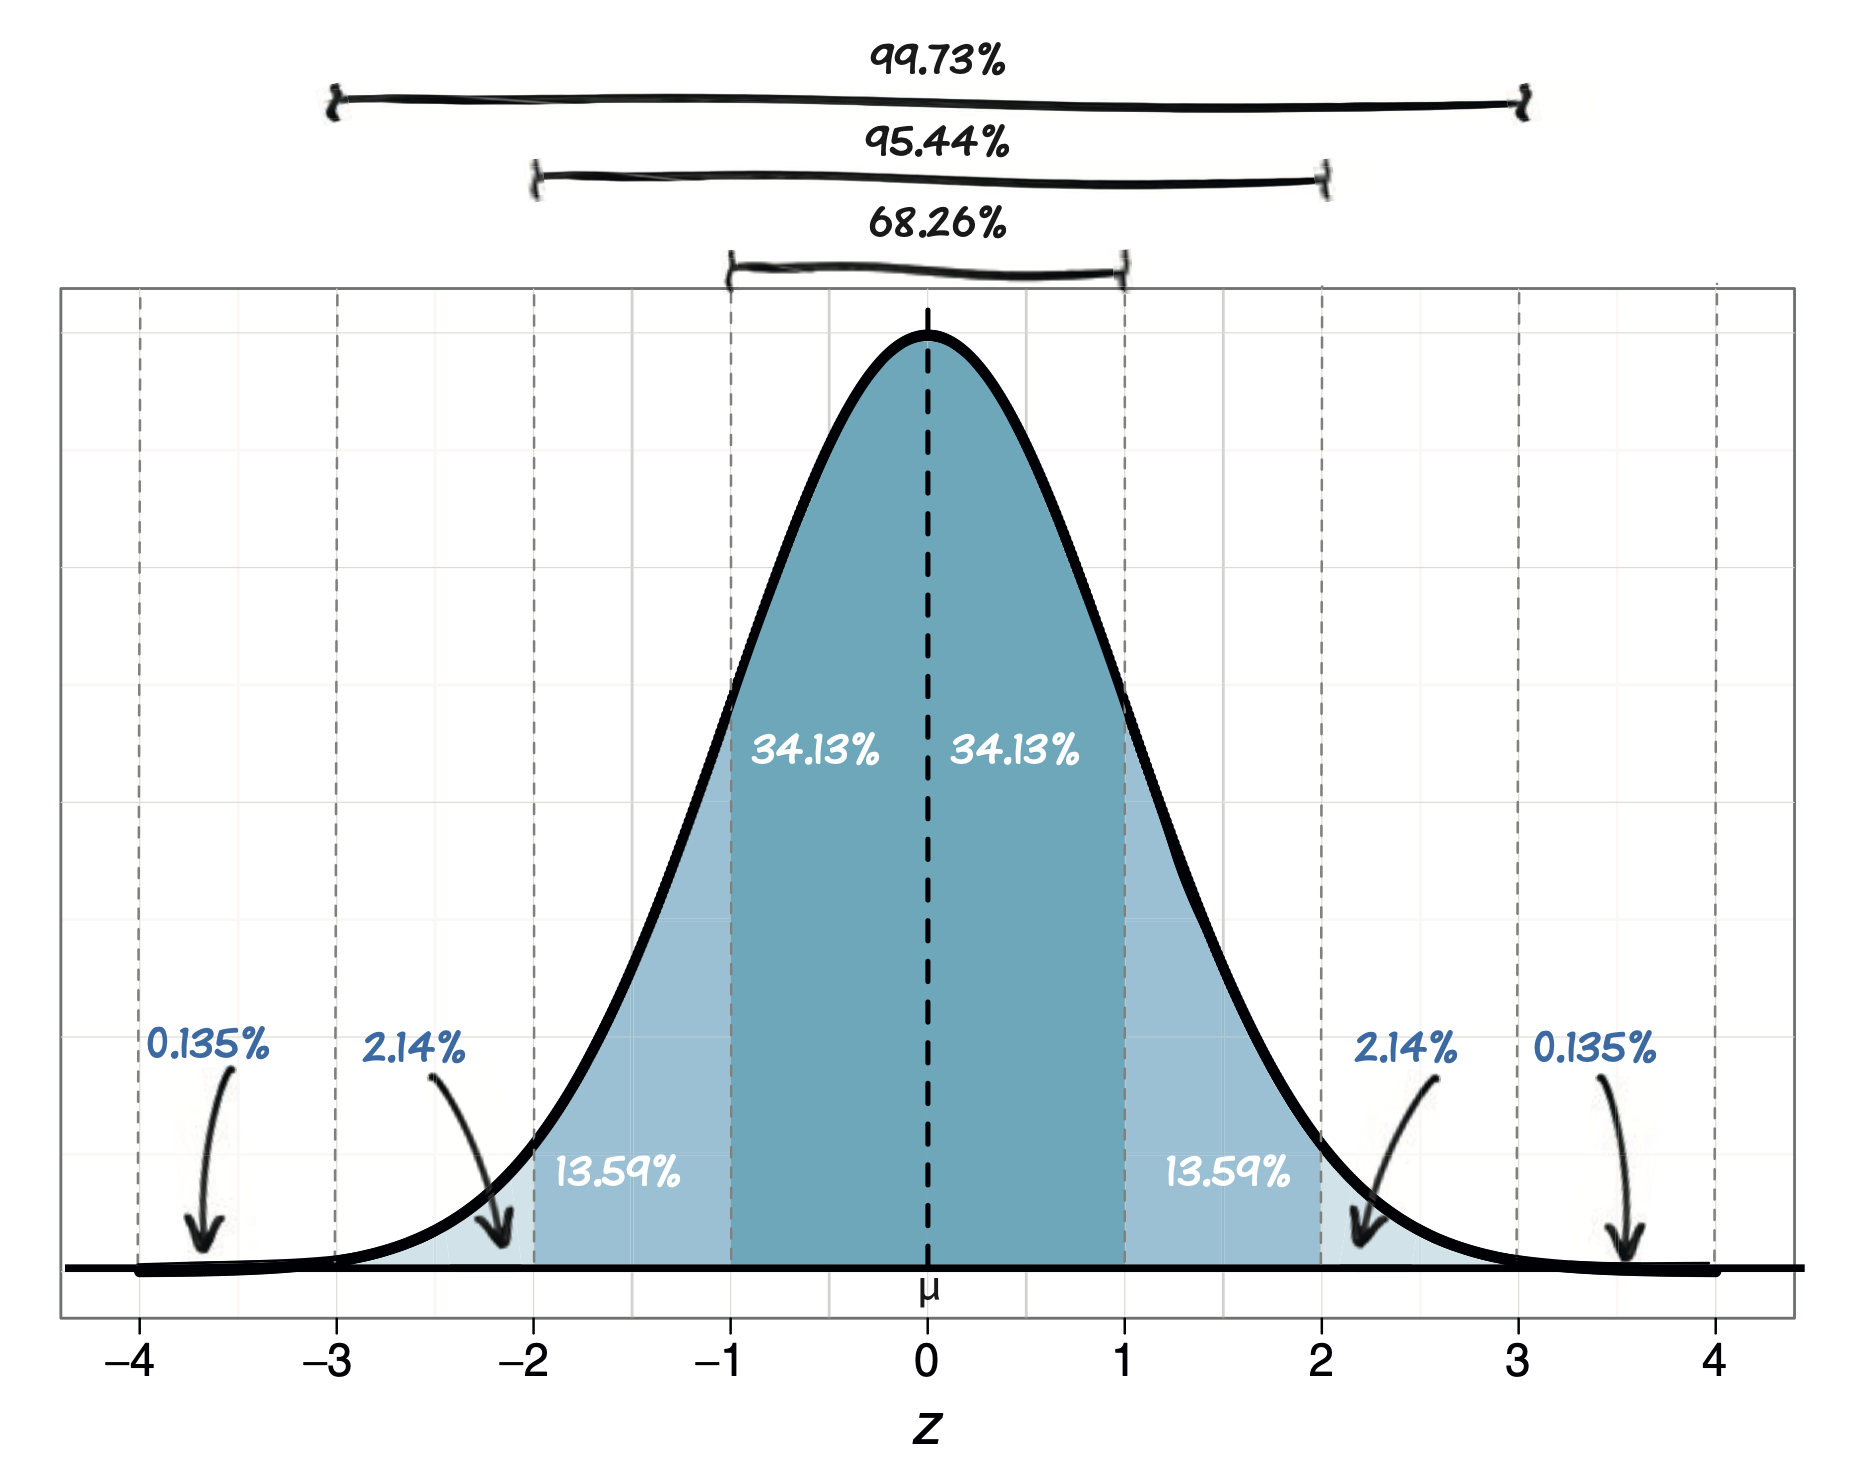
68% of the Data
Lies within 1 standard deviation (\(\sigma\)) from the mean (\(\mu\)).
Between \(\mu \pm 1\sigma\): Contains 68% of the total area under the curve.
95% of the Data
Lies within 2 standard deviation (\(\sigma\)) from the mean (\(\mu\)).
Between \(\mu \pm 2\sigma\): Contains 95% of the total area under the curve.
99.7% of the Data
Lies within 3 standard deviation (\(\sigma\)) from the mean (\(\mu\)).
Between \(\mu \pm 3\sigma\): Contains 99.7% of the total area under the curve.